Two weeks ago, I wrote a post that explored the May 2015 Houston floods and suggested some lessons that might be offered by the events. This topic attracted a large audience and generated a lot of questions and discussion. In my conclusion, I suggested that carriers might consider creating a flood analytic specifically for this city.
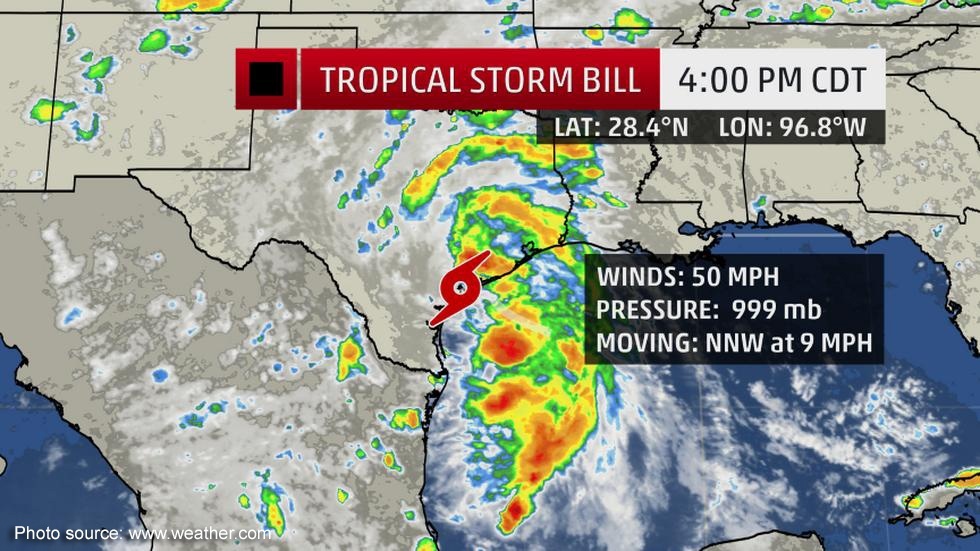
With Tropical Storm Bill currently bearing down on Texas, today I will take a closer look at how a carrier or underwriting group could use Intermap's risk assessment software, InsitePro, to build a new analytic to handle "Houston Flood" as a distinctive peril.
The Ingredients
Houston is a tricky place to insure against flood because the water is likely to come from three distinctive sources: rivers, rain, and the ocean. (Learn more about the three main types of floods here.) The long history of Houston flooding is rife with all three sources, with larger events frequently combining two or all of them. Last month’s floods were predominantly pluvial (rain), but there was some fluvial (river) flooding, as well. An effective Houston Flood analytic needs to handle all three.
In addition, these three ingredients would be critical to the analytic:
- An all-in-one risk score. Unlike other custom flood analytics Intermap is building, Houston Flood would benefit from having all three flood types analyzed in one score, rather than having the analytic determine when to look at each of them distinctly.
- Superior terrain data. Because Houston is a flat city, every foot of elevation counts. High quality terrain data with water features identified would add an empirical aspect to the analytic.
- Consideration for defenses. Houston has a lot of flood defenses, including dykes and flood overflows/bayous. A Houston Flood analytic should take these into account.
The Analytic
For the sake of simplicity, let’s make this analytic a score from 0 – 100. There are other ways to score a custom analytic, but this is a useful example. The scale can look something like this:

Step One would be to quantify the pluvial, fluvial, and surge flood risk. There are models available for each type of flood, and selecting the right model for each is important. Intermap offers a proprietary fluvial model with InsitePro (more to come on that later this month), NOAA publishes some useful surge information, and there are consultants who specialize in pluvial flood models. (Intermap is exploring a Houston pluvial pilot, if anyone is interested.)
In addition to all these models, there are of course FEMA FIRMs, which ensures we can have TWO models to use. Correlating flood risk from multiple models is a powerful piece of an analytic — it just needs to be decided if one flood model should be considered dominant; if they should be “averaged"; and how the correlation of the models should impact the score. Regardless of how this part of the analytic is defined, the result should be an initial score that will reflect cumulative flood risk from all three sources, attenuated based on the correlated results of BOTH models in each case. Locations at high risk of all three would probably already be in the Extreme category.
Step Two would be to add some geospatial aspect to the score. For Houston, where flooding can come from any direction (not just from the coast or the closest river), a localized elevation query makes sense. The elevation data could be checked to determine if a location is on a local high point, or a local low point. If a location is higher relative to the surrounding terrain, the score might decrease a bit. Conversely, being in a localized low spot should bump the risk score higher. The score can then be raised or lowered relative to proximity to a source of flooding (the coast, a river, a lake/pond). These parts of the analytic leverage the geospatial information, which is strong because it’s not so much a “model”, like a flood model — these values are directly measured values and not really open to interpretation.
Step Three is when the flood defenses can be considered for the scoring, but this is really a question of how conservative or aggressive a score should be. The most conservative approach would be to ignore defenses, while a more aggressive approach would assume the defenses would hold (up to a certain level of risk). Proximity to and position relative to flood defenses would adjust the score depending on the needed approach.
Step Four could add an additional piece of information in the form of a carrier’s own claims history for the city. (Claims history should always be used, but there is a caveat). Location-specific losses can be turned into a map, which is a potent addition to a flood risk score. And any carrier or underwriter who has been active in Houston will definitely have a history of losses to leverage in an analytic.
The above is a general approach to how the analytic could be built. The details are defined in a collaborative approach to ensure each InsitePro user gets an analytic that is in tune with their own view of risk, appetite, and approach (conservative/aggressive). No two Houston Flood analytics would ever be the same for any two users, because everyone who underwrites flood has specific experience and knowledge that would be reflected in their analytic uniquely.
To explore this further, please click below to contact us and learn more about creating custom analytics with InsitePro.

.png?width=500&name=InsitePro4%20(1).png)


Comment Form