This is a joint post by Ivan Maddox and Cyrena Arnold, Director of Product Sciences at Weather Analytics.
Hail. For property underwriters, hail is the peril that probably frightens them most. It is rarely excluded from homeowner policies, it is highly damaging, and very common in certain areas. Hail caused $6.6B in claims in the US in 2014 (AM Best), and there are hardly any decent underwriting tools to help out with it. In case a reminder was needed, here is AM Best’s coverage of Progressive’s Q1 results:
Net income dropped 13% at Progressive Corp. in the first quarter as catastrophe losses increased to $102 million, compared with $9 million a year earlier. Eighty percent of those losses came in March, when wind and hailstorms pummeled Texas and Louisiana.
Two hailstorms in the Dallas-Fort Worth metroplex caused insured losses industrywide of about $1.3 billion. A third storm in the region on April 11, with reports of softball-size hail and strong winds, may have been even more damaging (Best’s News Service, April 12, 2016).
Yikes – two storms worth $1.3B.
What has made hail so hard for insurers is how hard it is to predict, track, and verify. Or, at least it was. Since this blog is constantly heralding the importance of innovation and analytics, it’s time to take a close look at some new hail analytics.
Weather Analytics is a company that has made rapid progress with hail, along with other convective cat perils such as straight-line wind, rain, and tornado. For hail, they are delivering (right now) analytics that predict, track, and report actual hail storms.
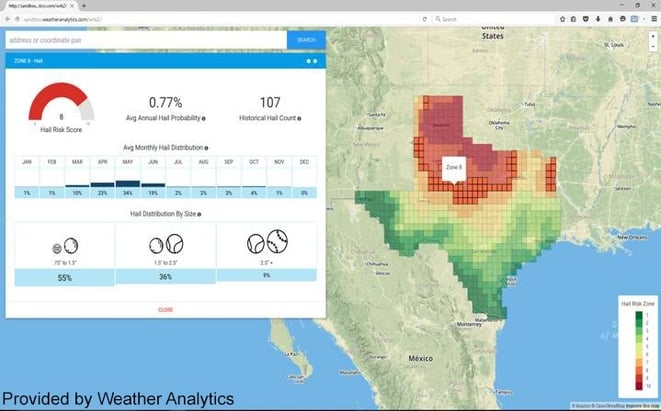
For underwriting, WA’s Gauge product delivers hail hazard maps for the contiguous US, complete with annual probability, historical info, month-by-month info, and size predictions (using the S.I. units for hail size: pennies, golf balls, tennis balls, and baseballs).

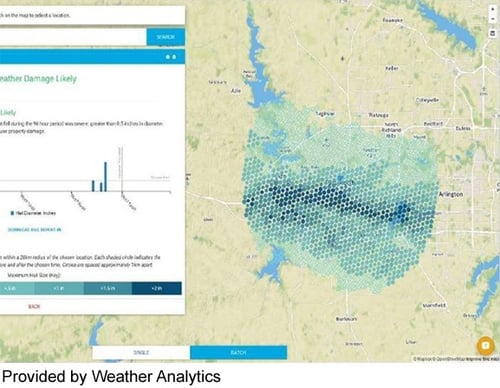
For the claims and fraud-prevention side, here is a sample of what WA had to say about the mega storm that hit the Fort Worth area in March.
- On March 15, WA’s Beacon application issued alerts by email that hail was possible in the Arlington area on March 17.
- Next, on March 18, WA’s Dexter application was able to report on the location and size of the hail (to the nearest hundredth an inch).

One of the real challenges of hail analytics is the localized nature of the peril. It can impact an area as small as one city block. For this reason, positional resolution and accuracy are really important. The information from Dexter was significantly more precise and resolved than NOAA’s storm reports (the current standard), at a resolution of 0.6 miles.
How can hail be tracked with more precision and accuracy than ever before? WA is utilizing several different databases and proprietary processes to determine the maximum diameter of hail that fell at a specific location, the day after it occurred.
This technology is very new, and it is generating excitement from both the claims and underwriting side of insurers. For underwriters, the annual probability metrics can easily be applied to business rules and underwriting processes. For claims, it drastically reduces the time adjusters spend in the field and provides better answers, faster. Best of all, for risk mitigation, the notifications (up to 7 days in advance) help avoid damage altogether. These analytics are the exact type of innovation the industry needs to remain relevant.

.png?width=500&name=InsitePro4%20(1).png)


Comment Form