
.png?width=500&name=InsitePro4%20(1).png "InsitePro Logo")
In August 2015, Lloyd’s and JBA Consulting published a white paper called California Flood – Central Valley Risk Analysis. At the time of publication, it was received with raised eyebrows as the state was in an historic drought. Characteristically, Lloyd’s took the long view and they released the study, knowing El Niño was on the way.
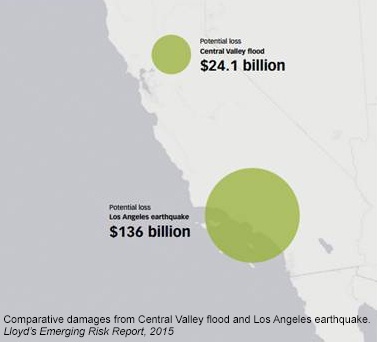
The report is very much focused on the accumulated flood risk in the Central Valley, including property, crop, and business interruption, and the figures it cites are as huge as expected – a potential loss exceeding $24B.
Where there is such potential loss, there is opportunity for bold underwriters. The concluding sentences of the Insurance Market section of the paper state it thus:
California is typically considered a potential growth market for flood insurance, but the Central Valley, in particular the Sacramento Valley, remains a challenging area to insure. The industry needs more sophisticated catastrophe modelling for the region and more investment in flood infrastructure.
A challenging area, indeed. Looking at the FIRMs for the area, it is an extreme example of underwriting with a paint-roller. Vast flood zones (15 miles wide in some places) are delineated as A zones, along with sizable fringes of X zones. It’s a broad valley with a lot of potential water flowing through it, some defended and some not so much.
How can an underwriter thrive in such a place?
With better analytics driven by more and better data – that’s how. InsitePro’s Flood Risk Score is one example of such an analytic, powered by:
- High resolution, accurate elevation data to discern the subtle terrain.
- Multiple flood models to get a variety of views of the risk.
- Algorithms that detect and differentiate subtle changes in flood risk.
Such a score allows underwriters to segment the risk at any given location by producing a score out of 100 for any given location. Once the risks are segmented, rates can be applied to the risks based on location-based assessments, and not by the simplistic zone determination. Consider the example below in Thornton, CA, with eight random locations spread across the town.

The chart below shows the InsitePro Flood Risk Score for each location, along with the NFIP zone. An underwriter trying to determine risk and rate based on NFIP data is frozen: all the risks are the same – A Zone. Meanwhile, the InsitePro Score shows clear segmentation of the risks. 
There is still work to do for the underwriter before each risk can be priced – the score needs to be calibrated to loss potential, and thresholds need to be defined based on appetite. But a score like this is what enables it to be done.
The next step to unlocking even more potential would be to develop a custom score to fit specific business needs, using the data that would be best suited to the purpose. For the Central Valley, JBA’s flood model would make a very useful component of such a score.
Lloyd’s is right to call the Central Valley a challenging place to underwrite flood. That makes it especially important to use software that is built for underwriting, and not for accumulation.


Comment Form